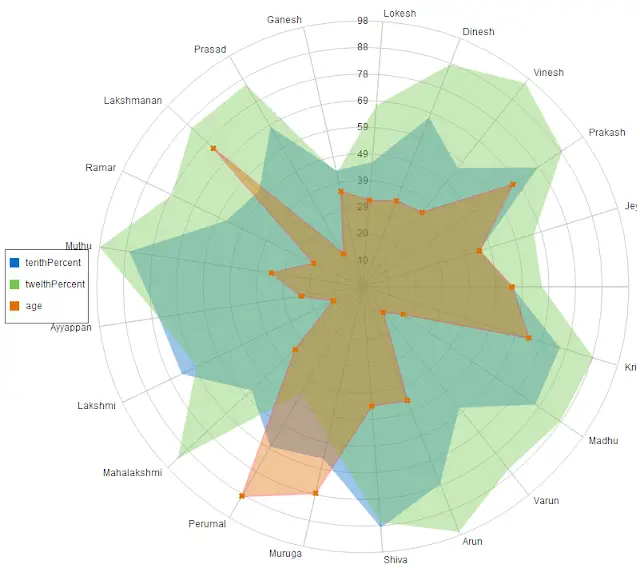
Sample Code:
Visualforce page:
<apex:page sidebar="false" Controller="Sample" showHeader="true" id="pg">
<apex:chart height="750" width="800" legend="true" data="{!data}">
    <apex:legend position="left"/>
    <apex:axis type="Radial" position="radial">
        <apex:chartLabel />
    </apex:axis>
    <apex:radarSeries xField="memName" yField="tenthPercent" tips="true" opacity="0.4"/>
    <apex:radarSeries xField="memName" yField="twelthPercent" tips="true" opacity="0.4"/>
    <apex:radarSeries xField="memName" yField="age" tips="true" markerType="cross" strokeWidth="2" strokeColor="#f33" opacity="0.4"/>
</apex:chart>
</apex:page>
Apex Controller:
public class Sample {

    public List<RadarData> data {get;set;}
    public sample() {
    data = new List<RadarData>();
        List<Member__c> memList = new List<Member__c>();
        memList = [SELECT Name, Age__c, X10th__c, X12th__c FROM Member__c];
        for(Member__c mem : memList) {
            data.add(new RadarData(mem.Name, mem.X10th__c, mem.X12th__c, mem.Age__c));
        }
    }
    public class RadarData {
        String memName {get;set;}
        Decimal tenthPercent {get;set;}
        Decimal twelthPercent {get;set;}
        Decimal age {get;set;}

        public RadarData(String memName, Decimal tenthPercent, Decimal twelthPercent, Decimal age) {
            this.memName = memName;
            this.tenthPercent = tenthPercent;
            this.twelthPercent = twelthPercent;
            this.Age = age;
        }
    }
}
Output:
