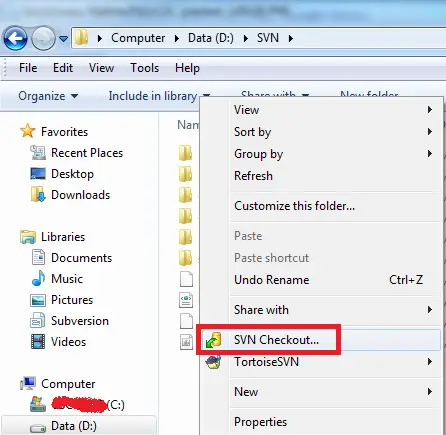
1. Check out the project using Tortoise SVN Checkout.. option.
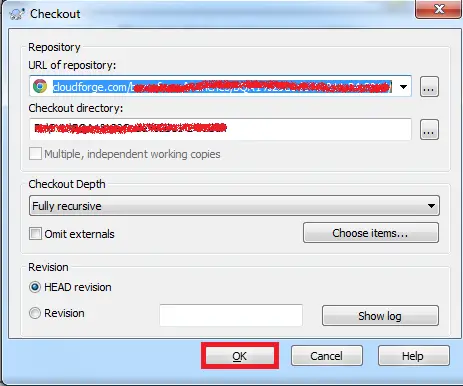
2. Give the URL and select the Directory.
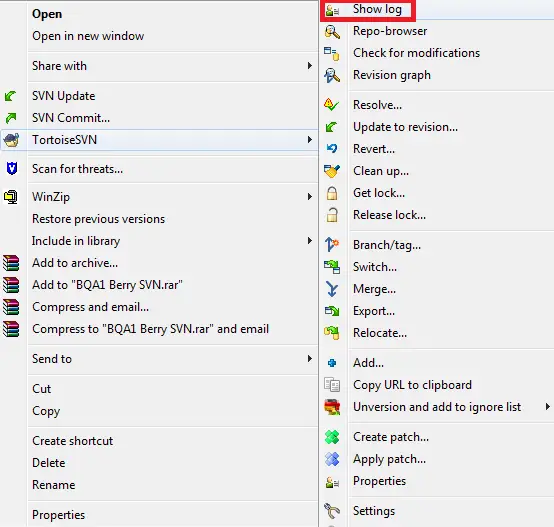
3. Right Click the checked out project and select Tortoise SVN –> Show Log.
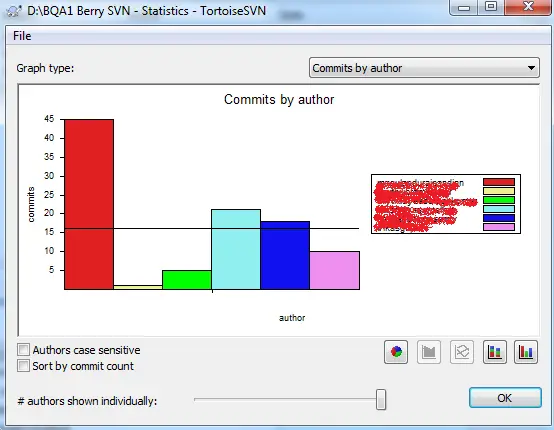
4. Click “Statistics” button.
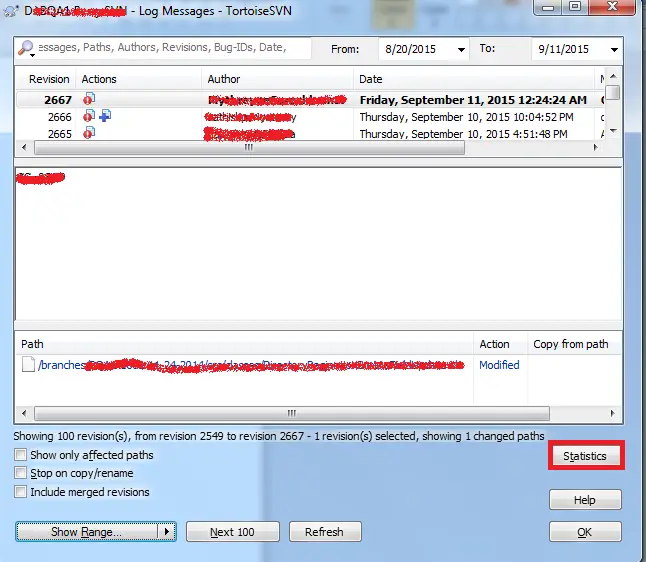
5. Select the different Graph type for the reports.