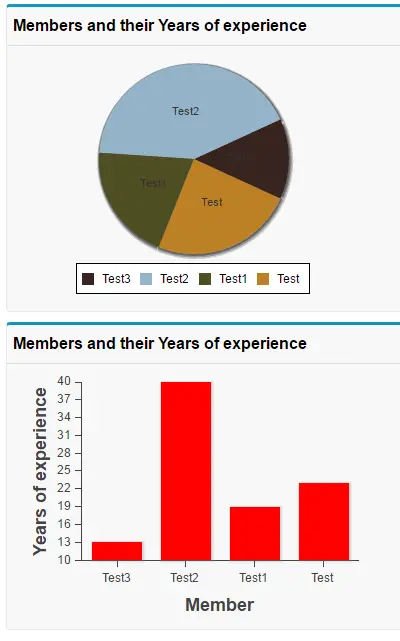
To provide a set of color definitions to draw data series elements (bars, pie wedges, and so on), use the colorSet attribute. Set <apex:chart colorSet=”…”> to specify the colors to be used for every data series in a chart. Set colorSet on a data series component to specify colors for that series only.
Sample Code:
Visualforce Page:
<apex:page controller=”Sample”>
<apex:pageblock title=”Members and their Years of experience” >
<apex:chart height=”250″ width=”350″ data=”{!pieData}”>
<apex:pieSeries tips=”true” dataField=”data” labelField=”name” colorSet=”#37241E,#94B3C8,#4D4E24,#BD8025,#816A4A,#F0E68C”/>
<apex:legend position=”bottom”/>
</apex:chart>
</apex:pageblock>
<apex:pageblock title=”Members and their Years of experience” >
<apex:chart height=”250″ width=”350″ data=”{!pieData}”>
<apex:axis type=”Numeric” position=”left” fields=”data” title=”Years of experience”/>
<apex:axis type=”Category” position=”bottom” fields=”name” title=”Member”/>
<apex:barSeries orientation=”vertical” axis=”left” xField=”name” yField=”data” colorSet=”red”/>
</apex:chart>
</apex:pageblock>
</apex:page>
Apex Controller:
public with sharing class Sample {
public List<PieWedgeData> getPieData() {
List<PieWedgeData> data = new List<PieWedgeData>();
List<Member__c> memb = new List<Member__c>();
String sql = ‘SELECT Name, Year_s_Of_Experience__c FROM Member__c’;
memb = Database.Query(sql);
for(Member__c temp:memb)
{
data.add(new PieWedgeData(temp.Name,temp.Year_s_Of_Experience__c));
}
return data;
}
// Wrapper class
public class PieWedgeData
{
public String name { get; set; }
public Decimal data { get; set; }
public PieWedgeData(String name, Decimal data)
{
this.name = name;
this.data = data;
}
}
}
Output:
Cheers!!!
