Use Developer Console checkpoints to debug your Apex classes and triggers. You can’t set checkpoints in Visualforce markup.
Checkpoints persist until you click Debug –> Clear Checkpoint Locations.
Use checkpoints to investigate the objects in memory at a specific point of execution and see the other objects with references to them.
If you set a checkpoint in a method with the @future annotation, you must keep the Developer Console open until the @future method completes asynchronously.
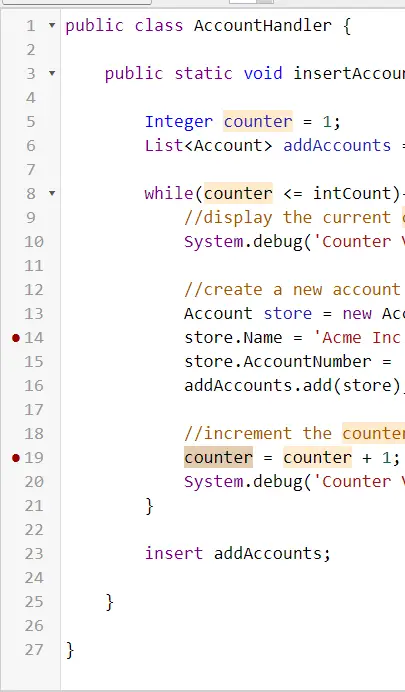
1. Select the Lines for Check Points.
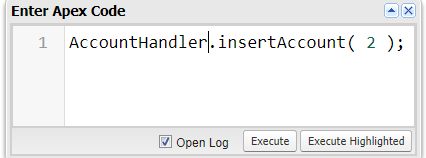
2. Execute the code from Anonymous Execute window with Open Log check box checked.
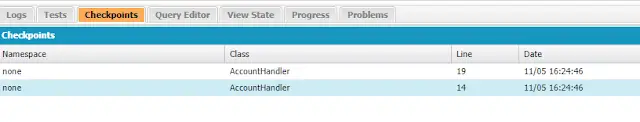
3. Go to Check Points tab to view the values at the run time.