
1. Create a report.
2. Group it using a field/column.
3. Use Add Chart and add a Line Chart.
4. Select “Cumulative” option.
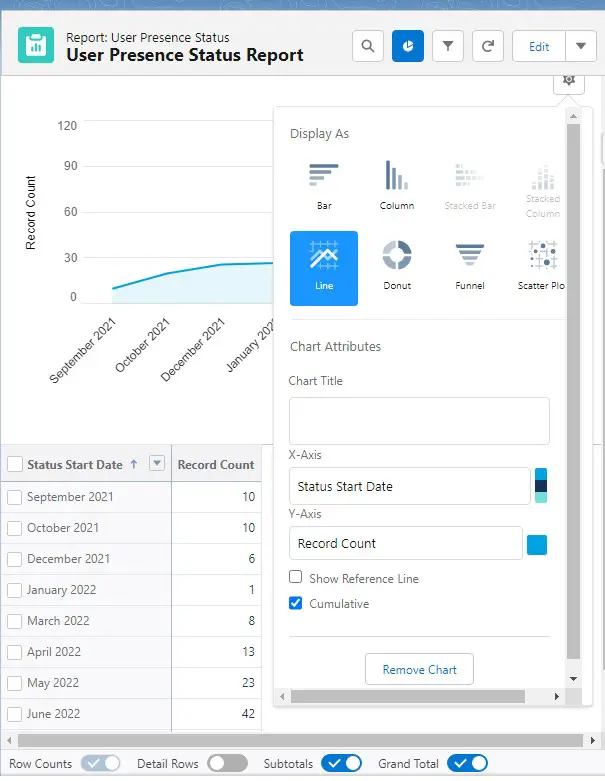
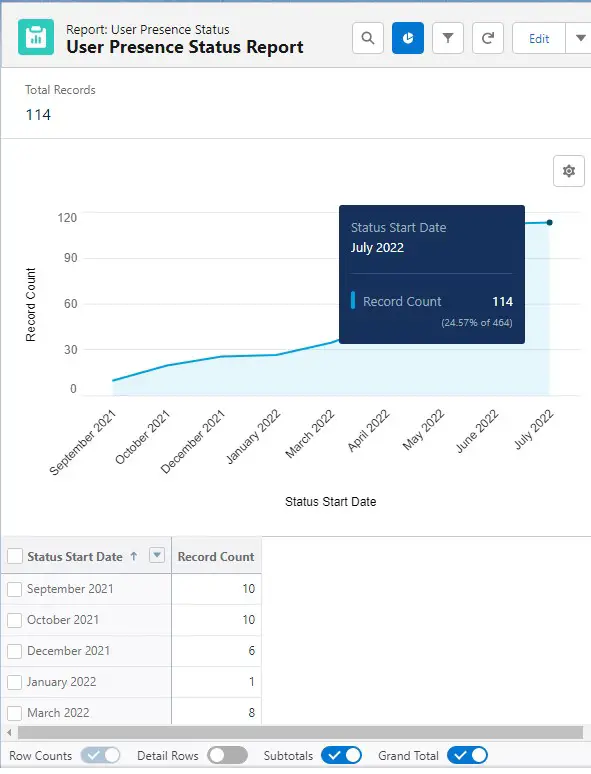
Output:
1. Create a report.
2. Group it using a field/column.
3. Use Add Chart and add a Line Chart.
4. Select “Cumulative” option.
Output: